Introducing Market Grid—the fastest, easiest way to screen markets and identify high-potential trade areas from Sitewise Analytics. Learn more about what it is, how it works, and why you’ll love using it to scan markets for potential.
Expanding without market insights is a gamble. That’s why multi-unit brands build site selection criteria on their experience with their target customers and successful stores. But the more complex that criteria, the harder it gets to screen markets for great trade areas.
Market Grid eliminates the guesswork, giving you trade area insights—fast, accurate, and free.
What is Market Grid
Market Grid is a market scanning tool that produces heatmaps of populated US markets using a uniform grid of data-rich hexagons. Its multivariate filters make it easy to refine the heatmap for as many data and trade area variables as you like.
Once you’re done, Market Grid instantly highlights the trade areas most likely to fit your checklist, so you can scan markets in seconds. All that’s left to do is prioritize where to look for real estate!
How it works
The hexagon grid
Market Grid structures geospatial data into a uniform grid of 1-mile hexagons. The center of each hexagon represents a potential site, and each site is packed with pre-processed data.
Unlike block groups which vary in shape and size, Market Grid’s hexagons create a consistent framework for market screening and analysis. That means you can look at the same data in the same market, but the block group and grid heatmaps won’t look quite the same.
Let’s look at these heatmaps of median household income in the Dallas-Forth Worth market:
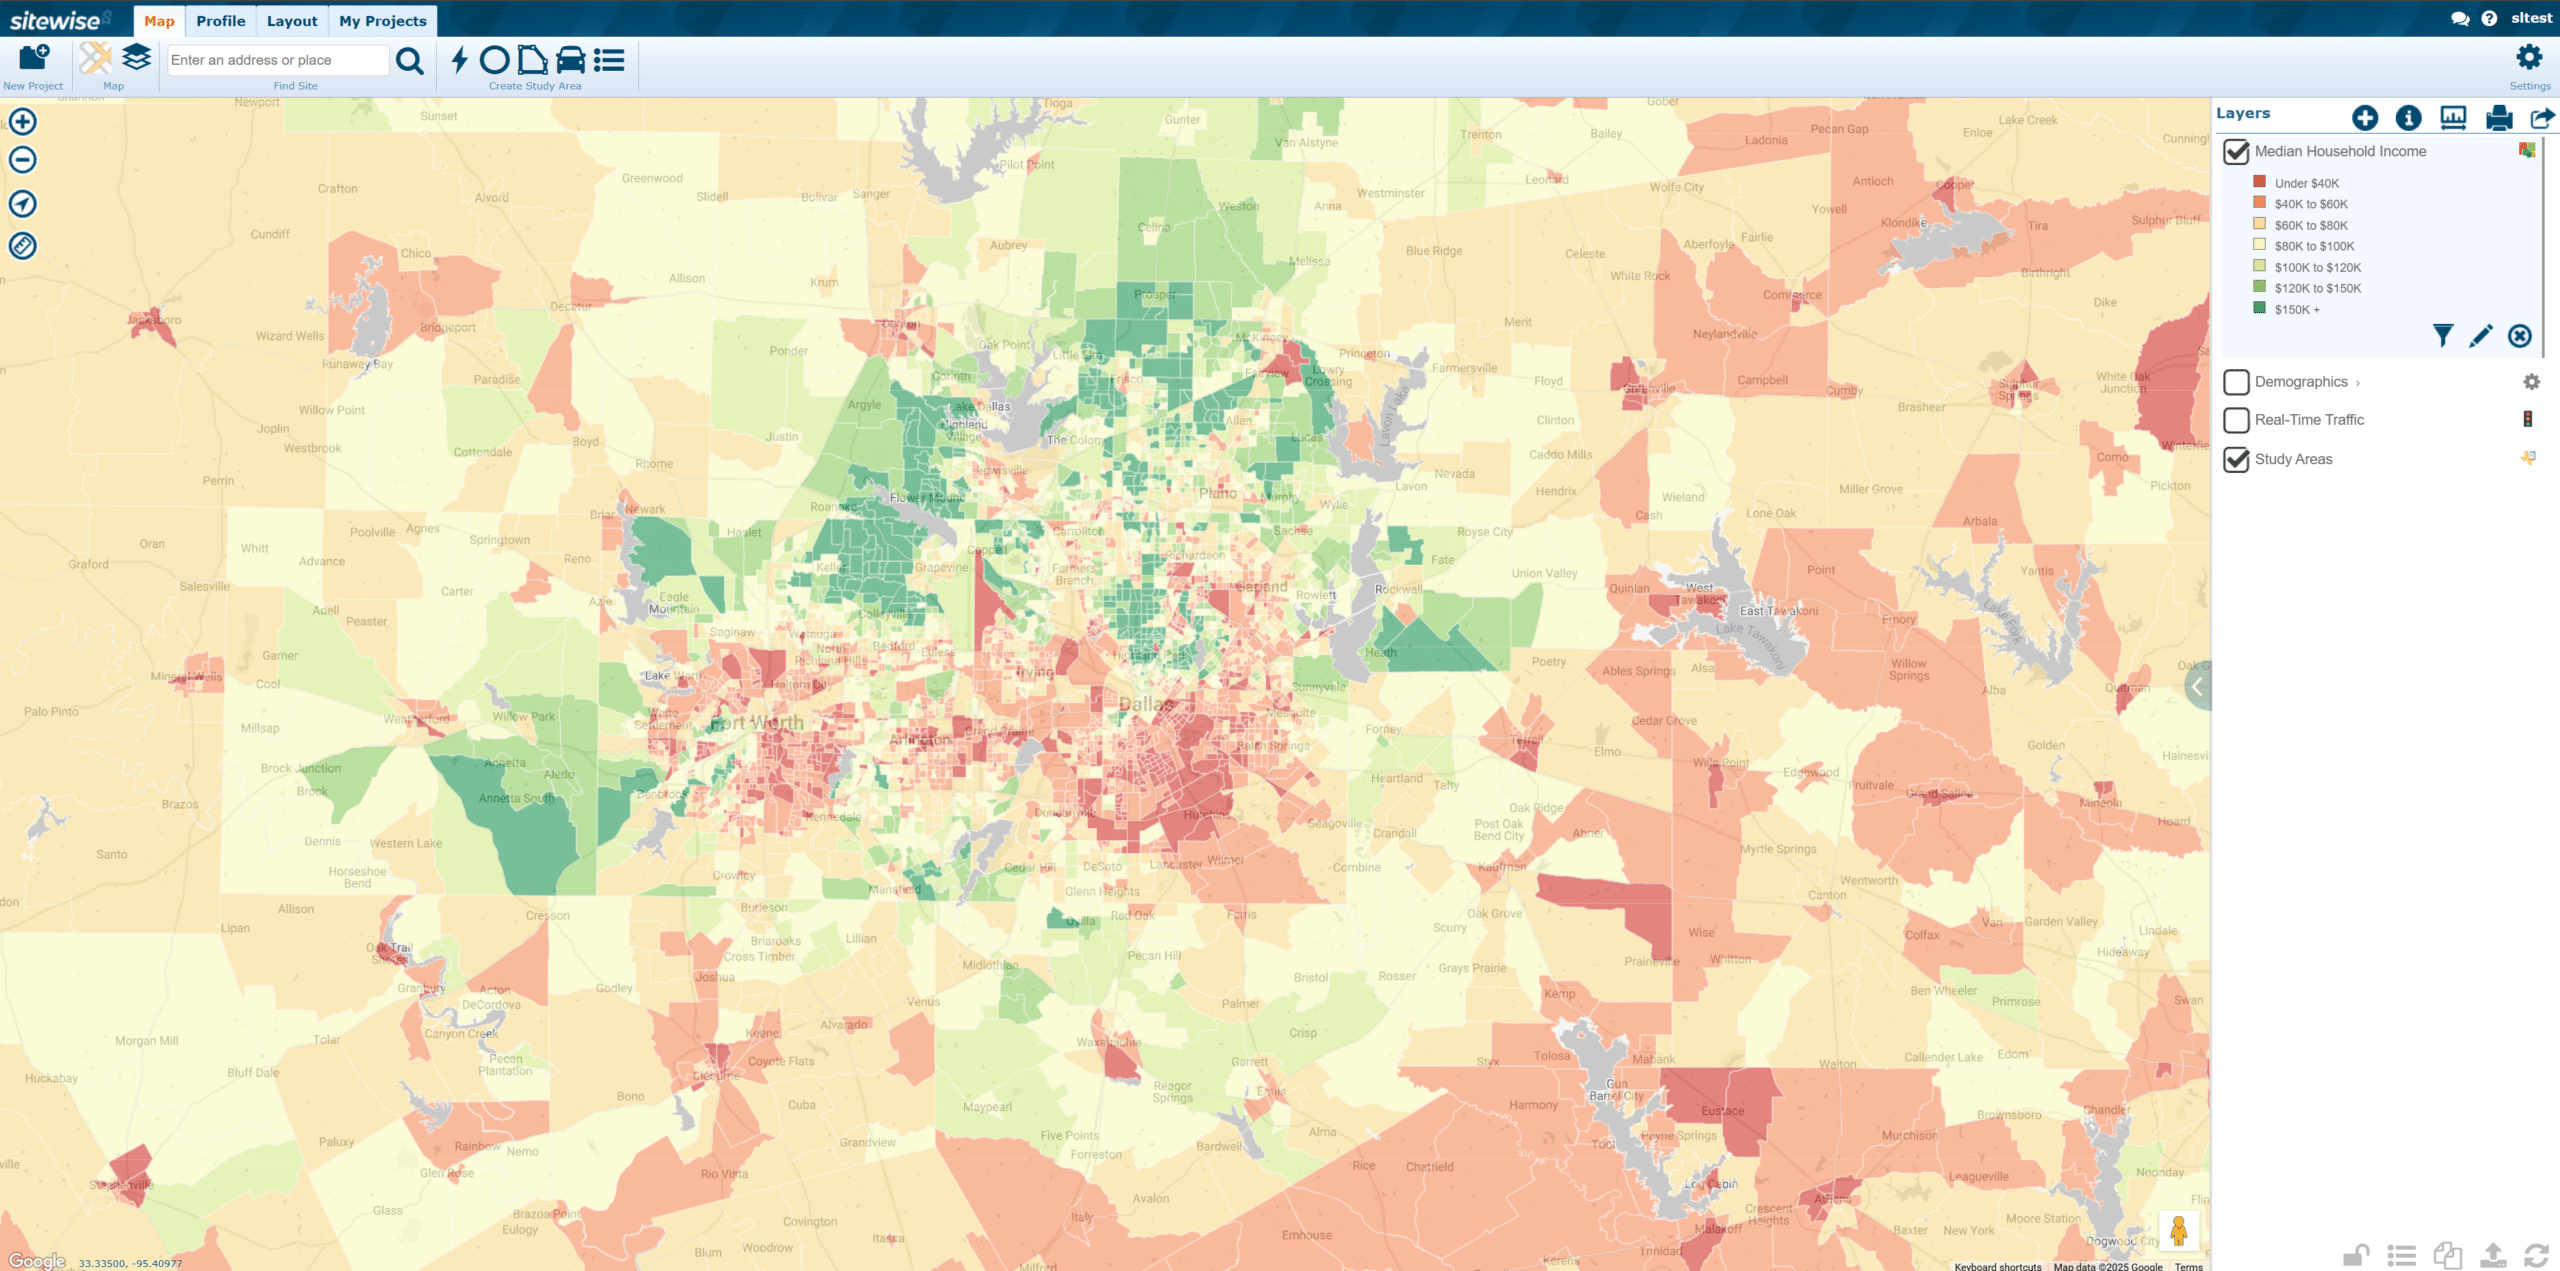
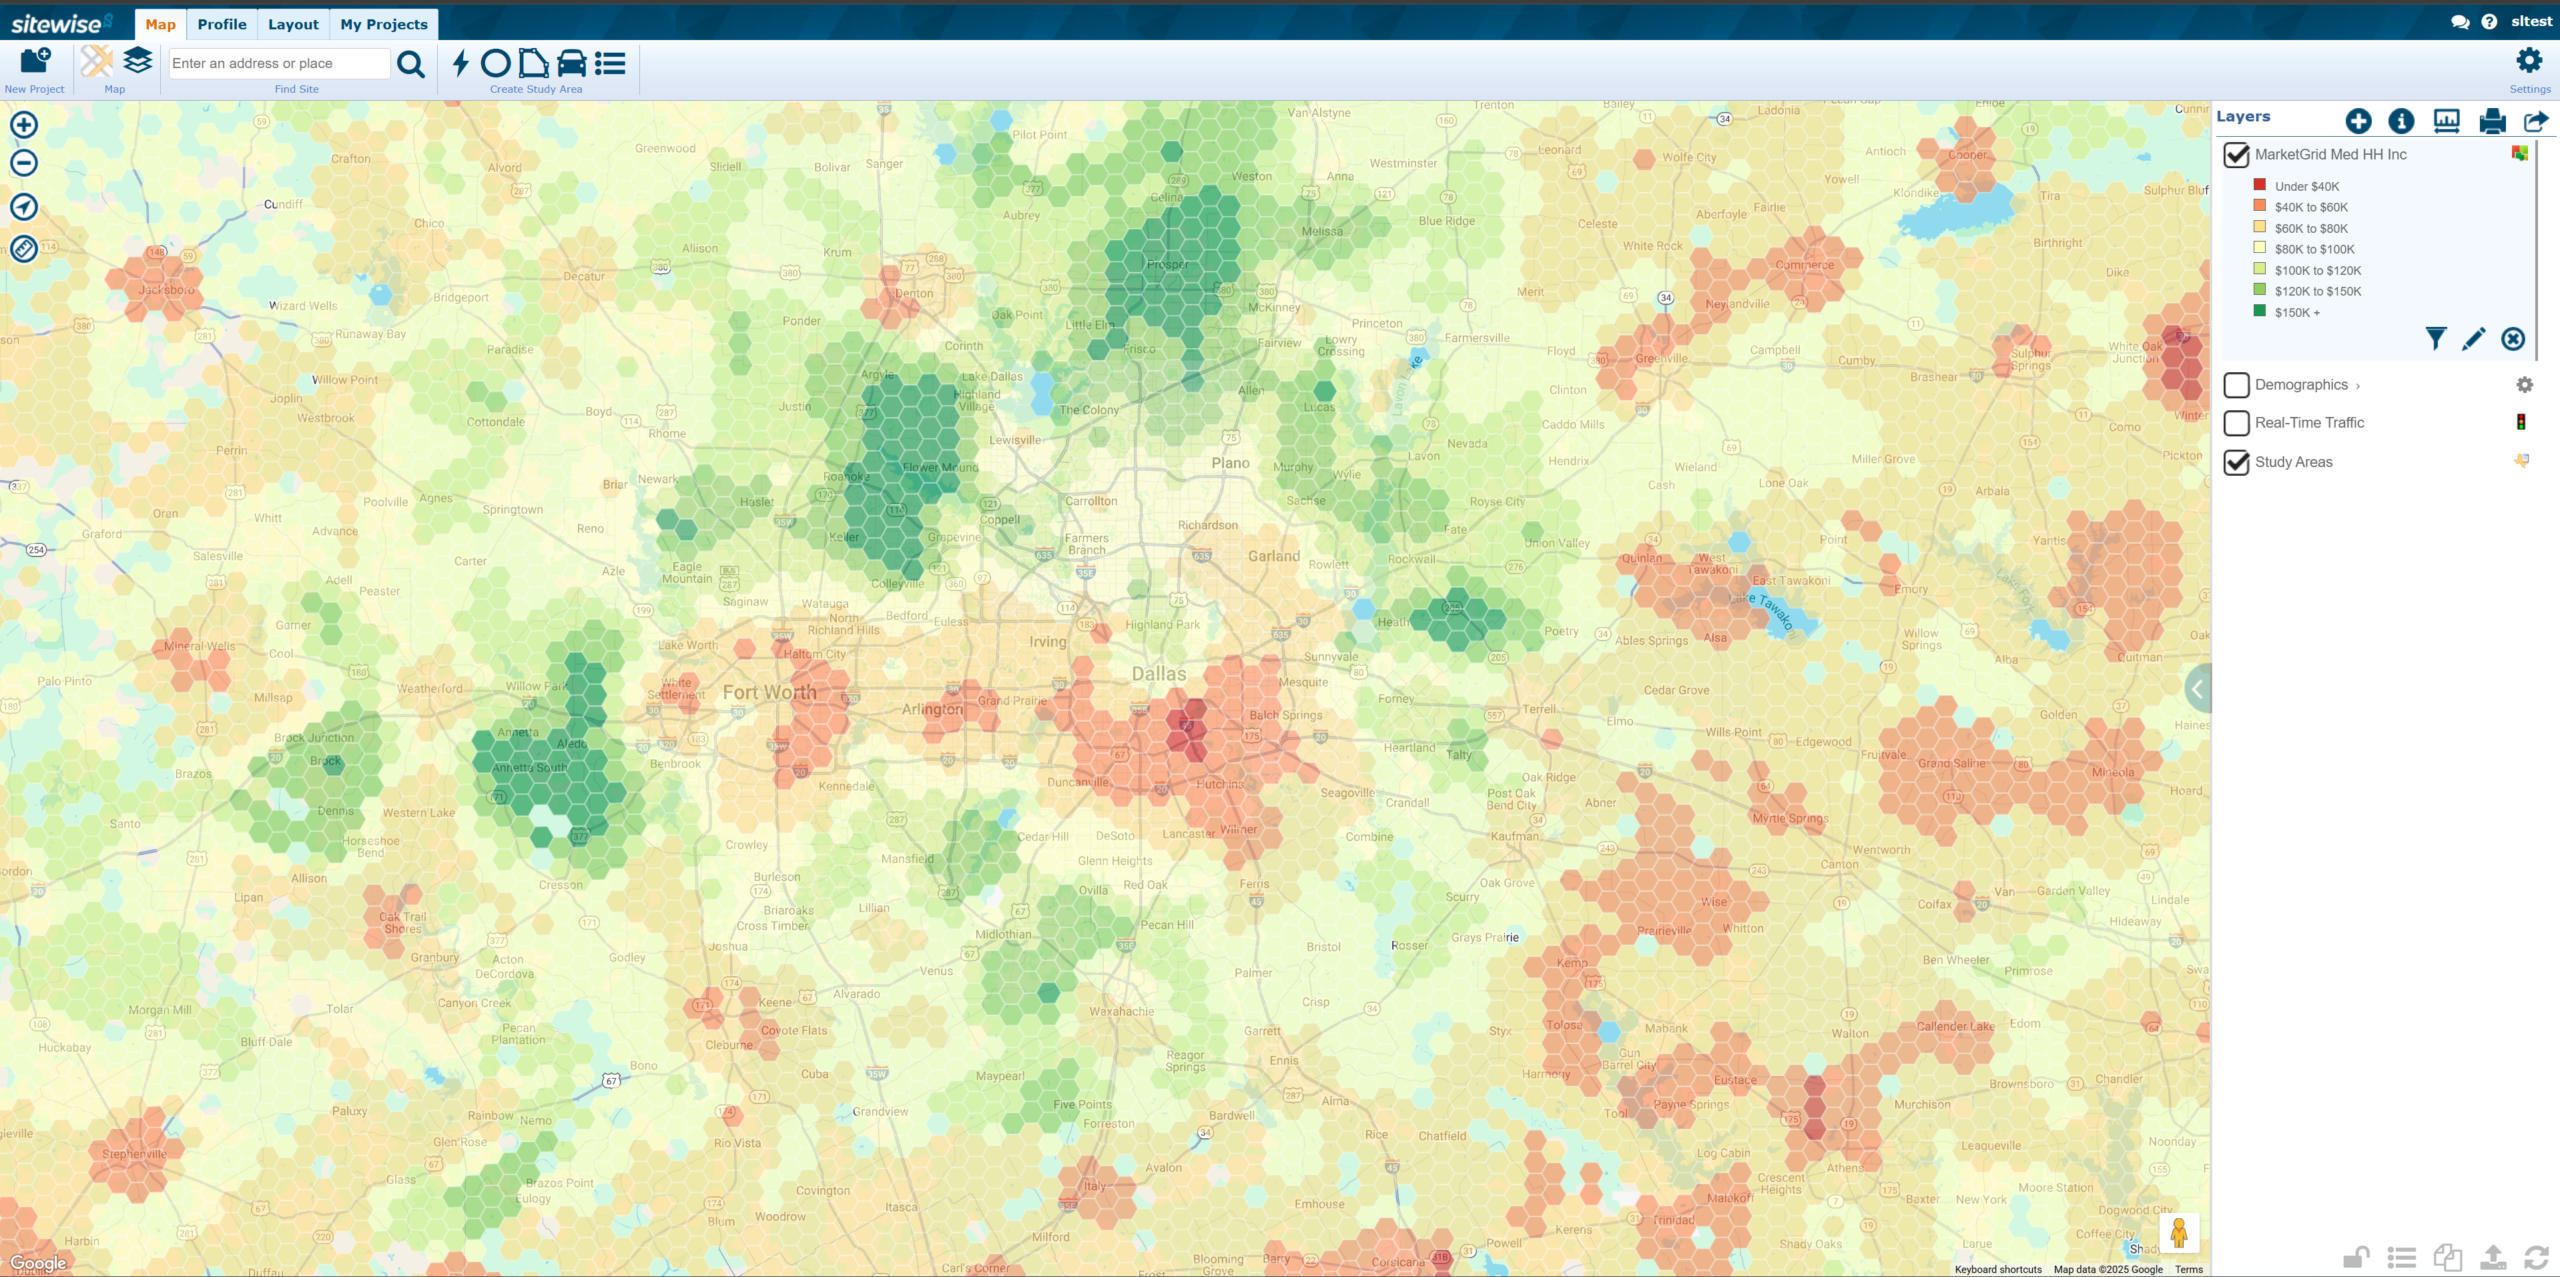
Dallas Fort Worth median household income
When you slide back and forth between the maps, the difference is obvious. Uniform hexagons highlight real population patterns on a more granular level, revealing insights you’d miss with block groups – like pockets with zero people.
Now, imagine you’re a multi-unit brand expanding from Houston to Dallas. You know your sweet spot is 1-mile rings with median incomes between $100K-$120K. Which map would you trust for your next move?
The multivariate filters
Because Market Grid runs on pre-processed data, it delivers near-instant calculations. That’s where filters come in. Let’s run through the process, step-by-step.
Choose from Market Grid’s 70+ curated data fields, like:
- Demographics (population growth, income)
- Employment (daytime population, jobs)
- Consumer spending (retail, dining)
- Competitors & cotenants (chain locations, shopping centers)
- Places (public hospitals, schools, universities, etc.)
License Restaurant Trends, traffic or crime data? Factor in:
- Traffic counts (AADT, peak-hour volumes)
- Restaurant Trends (chain performance)
- Crime (relative crime and security risk)
Note: For a small setup cost and low annual fee, Market Grid+ integrates your internal data (like customer locations) and offers more options to customize data variable options to your needs.
Market Grid calculates your filtered data from the center of every hexagon out to your specified trade area. All you have to do is select from preloaded trade area variables for your analysis:
- Distance rings (1, 3, 5, or 7 miles)
- Drive times (5, 8, 10, or 15 minutes)
Click “Apply”, and Market Grid instantly transforms your data into a heatmap, highlighting top-matching trade areas.
Now, you can zero-in on optimal locations with confidence.
With your ideal trade areas on the heatmap, now it’s time to zero in on the best locations within them to grow your brand and maximize ROI.
Take the next steps in Sitewise Platform or Sitewise Mobile.
Want to target a specific shopping mall or key road network? Run reports like site packages or scorecards to refine your market plan and seamlessly move through your development pipeline.
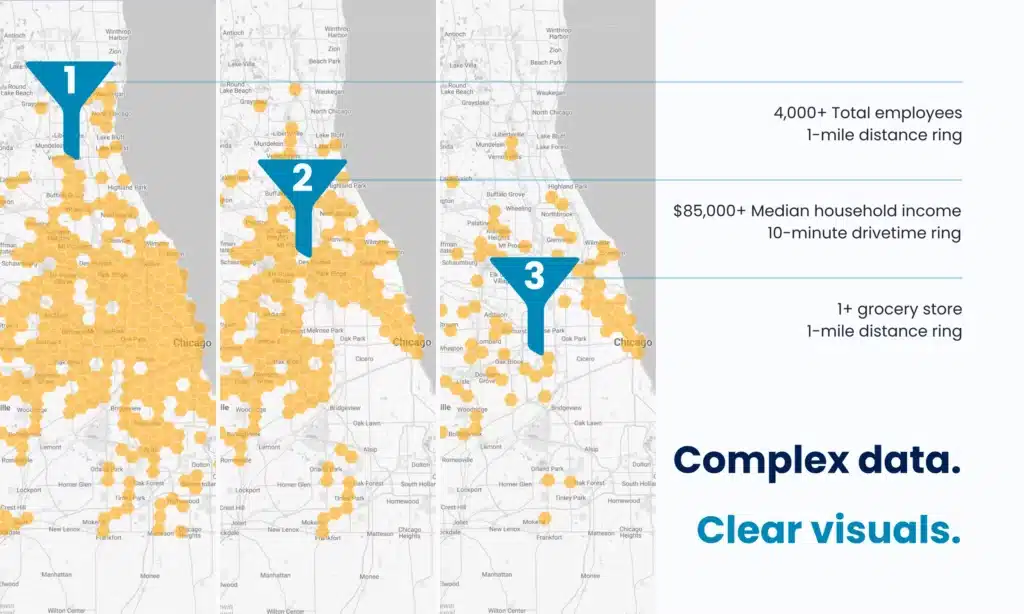
Combining the grid and the filters, Market Grid turns complex data calculations into clear visuals. That means the more filters you add, the more targeted your market screening becomes. For example, let’s say you’re entering the Chicago market:
- 1 filter for hexagons with over 4,000 employees in a 1-mile ring gives you a lot of turf to investigate.
- Add another filter for locations with a median household income of $85,000 or higher within a 10-minute drivetime ring, and you cut the results in half.
- Once you add one more filter for sites that have at least one grocery store within 1 mile, hundreds of potential trade areas narrow down to tens.
Who it's for
Market Grid is the go-to market screening tool for any brand that needs accurate location insights for real estate, development or market strategy.
We built this dynamic tech for anyone who needs to pinpoint high-potential trade areas fast. Whether you’re leading strategy or deep in the data, this tool delivers instant, actionable insights for:
The executive
Get rapid market breakdowns without a big price tag or rough roll-out.
Market Grid helps you spot the right opportunities and avoid bad bets, while improving market penetration, ROI and morale.
The manager
Bridge the gap between the C-suite and your team with market scanning solutions, processes, visuals and reports that enable great strategic decisions without burning out your team on compiling complex reports.
The analyst
Skip the grunt work. Market Grid transforms pre-processed data into a tool that simultaneously analyzes multiple factors so you can filter to explore market dynamics and deliver smarter recommendations – fast. Your company grows, you grow and people notice.
The broker
Turbocharge trade area scans and slash turnaround time to all your clients at multi-unit brands. With faster insights you can close more deals and get on track to be your brokerage’s top earner!
How it grows with your brand
Scalability is a big part of our brand DNA, so we built a market screening tool that grows with your brand.
It makes market screening accessible at any stage of brand growth, whether you’re working at or with a multi-unit restaurant, retail or service brand. Check out the opportunities available with Market Grid, including customization options, pricing and roll-out times:
Market Grid
70 curated geospatial data variables. 8 preset trade area options. Endless market insights. $0.
Market Grid’s ready-made market scanning solution is free to any brand with a Sitewise account. Its out-of-the-box data and filtering options put you on the fast-track to visualizing your ideal trade areas nationwide.
Plus, you don’t need a ton of customer and store data or a sales forecast model to take advantage of Market Grid. Setup is simple: if you already have a Sitewise account, we can add Market Grid to your account today – just ask!
Market Grid+
Market Grid+ is for those who want more —more data, more flexibility, and more precision. This highly customizable option gives you all the dynamic features of Market Grid, plus the power to:
Choose data
Go beyond 70 standard variables and handpick from 2,500+ options.
Integrate internal data
Bring in customer insights, pipeline locations, and more.
Pick POIs
Focus on strategic places like retail chains, banks, schools, stadiums, and more.
Automate updates
Our workflows trigger internal data updates on your schedule.
Customize calculations
Generate metrics you want, whether that’s population per competitor or customers per population.
Deep market screening
Filter for custom variables like market penetration or competitor density to discover high-opportunity trade areas.
Because it’s tailored to your needs, Market Grid+ setup takes a little longer. That means it costs a little extra too — this includes a one-time set up cost and a low annual fee.
Ready to power up your market insights? Contact our Sales team today.
Ready to get on the grid?
Alright we’ve done our job – you’ve learned enough about Market Grid!
But what can you learn with it? If you’re ready to explore Market Grid further, you have two options:
Ask your account administrator to contact your friendly neighborhood Sitewise Support team member to activate Market Grid in your account today or get started with the Market Grid+ setup.
Talk to our sales team today to talk about how to partner with Sitewise and start using Market Grid.
We can’t wait to help
you transform how you screen markets and identify ideal trade areas!